
Plan a dashboard using public data feeds
A live globe with 13,846 aircraft, 18,833 satellites and 30,666 traffic cameras on it — eight of them Singapore's. No login, no backend, no secret.
By Alan Brown
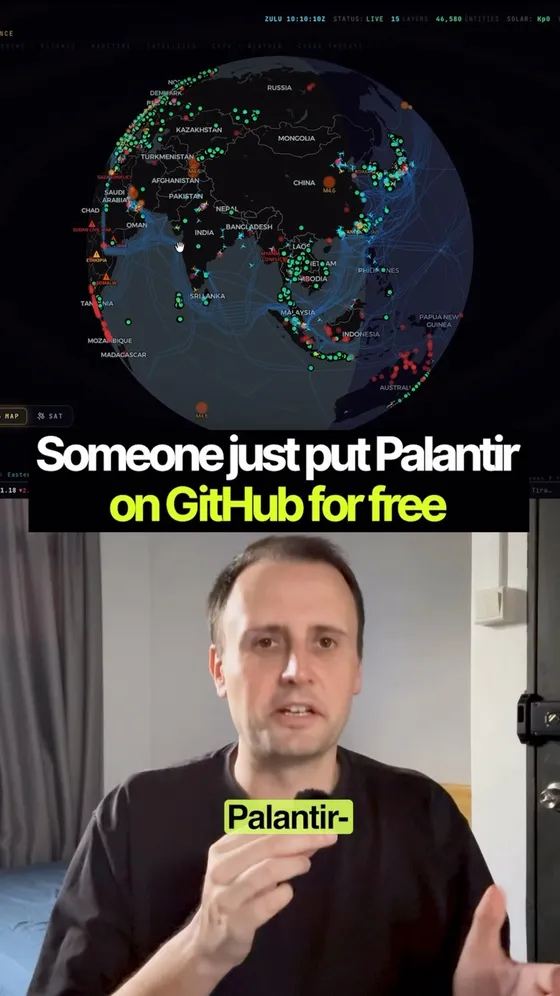
Looks classified. Costs nothing. Runs in your browser. 🌍 Osiris looks like a government intelligence terminal — a live 3D globe tracking 10,000+ aircraft, 2,000+ satellites, and CCTV feeds around the world in real time.
- 🧩 But here's the part that makes it click: it's not magic. It's a Next.js app wiring together public feeds — OpenSky for flights, plus earthquake, wildfire, maritime, and news data — into one dashboard. No login, no paywall, no secret backend.
- 🎛 And you drive it. Edit the filters, find local fires near you, zoom in, and pull a live news feed on that exact spot.
- 💡 The wild part? "Looks expensive" and "is free" aren't opposites.
- 👇 It's live at osirisai.live and the code is at github.com/simplifaisoul/osiris — MIT licensed, clone it and run it yourself.
Context & limitations
Every number in the caption is too small, and I checked by calling the same public API the map calls. At 23:13 Singapore time on 10 September it returned 13,846 aircraft (9,272 commercial, 3,362 private, 614 private jets, 343 military), 18,833 satellites rather than 2,000, and 30,666 cameras across 48 regions. Also 2,031 active fire hotspots from NASA FIRMS and 30 live news streams. The flights response is tagged "opensky-anon" with "opensky_auth: false" — which is the no-login claim proving itself in its own output.
Where the cameras come from is the whole point. FDOT 4,953, GDOT 4,043, Taiwan's THB 2,222, Caltrans 2,000, Spain's DGT 1,917, DriveBC 1,062, Hong Kong Transport Department 1,013, TfL 890 — highway and transport authorities publishing their own traffic cams, exactly as they always have. LTA Singapore is in there too, with 8. Nothing is hacked and nothing is leaked. What makes it feel classified is that nobody had bothered to put it all on one screen.
"Real time" is doing some work, though. Not every layer is live: the maritime layer ships as static naval intel — 39 ports and 10 chokepoints, with Singapore at rank 2 — and every port marker reads "LIVE: 0" on the demo because no AIS key is configured. The 13 conflict zones are static too. And the earthquake endpoint returned a 502 the first time I called it and worked fine a minute later, which is the honest shape of this thing: it's a stack of other people's free feeds, and if you build on it you inherit every one of their outages. That's step 6 of the prompt above, and it's in there because of that 502.
The RECON toolkit is the part to be careful with, and it's the part the clips skip. Port scanner, DNS and WHOIS, SSL inspector, CVE vulnerability scanner, crypto wallet tracing, OFAC sanctions search, and a scraper for public Telegram channels. On the hosted demo it just returns 503 unless you stand up your own scanner backend — but if you self-host, the project's own SECURITY.md is the line to hold: "Do not use OSIRIS to scan, probe, or interact with infrastructure, networks, or systems that you do not own or have explicit authorization to monitor." Looking at a map is browsing. Pointing a scanner at somebody's server is a different activity with a different legal name, wherever you live.
And the bit nobody posts: it has a coin. The GitHub description ends in a pump.fun token address, the live app carries a "$OSIRIS SUPPORT" button in the corner, and the Patreon perk is described by the README itself as "Currently Just a Cool UI". 9,148 stars and 1,868 forks in the four months since 12 May. The code is MIT and the dashboard really is free — and there's a token riding on the attention, which is worth knowing before you file this under pure public service.
Do this yourself
Verified endpoints and an explicit stale-data state make a dashboard more trustworthy. Compare Free alternatives to the AI tools you pay for for tool selection.
Want to build this with a teacher?
Pathwise Academy runs small, hands-on AI classes in Singapore for ages 10–17 and adults.